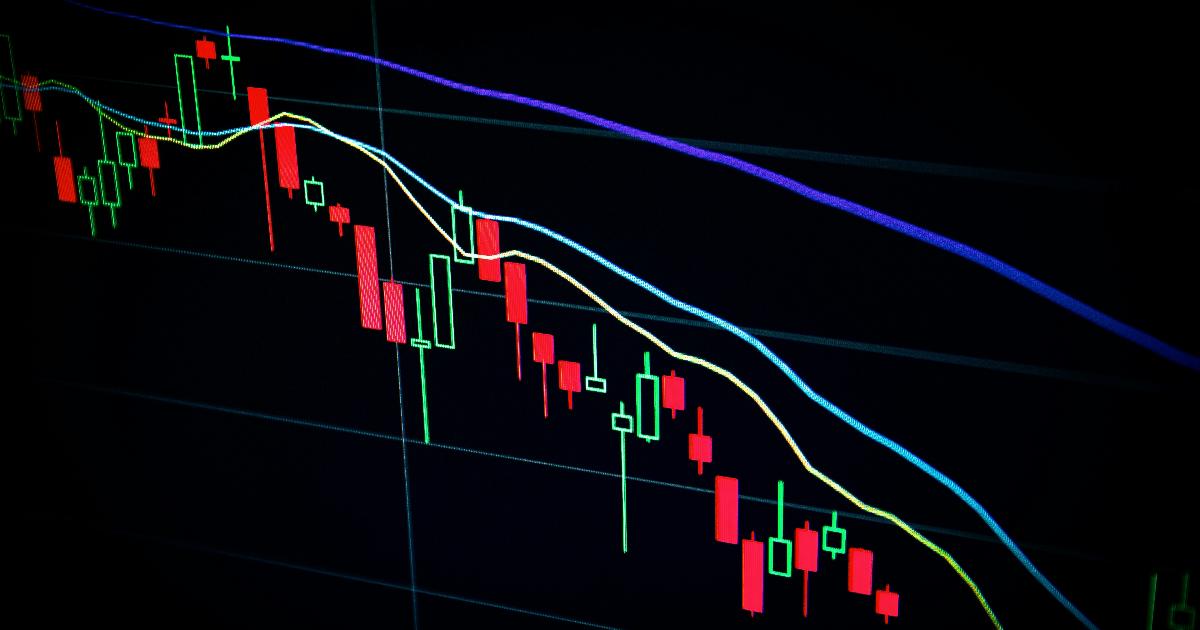
Where the danger actually concentrates
A widely cited analysis of S&P 500 total returns (including reinvested dividends) from 1975 through 2025 tested every possible starting point over that half-century, rather than cherry-picking a handful of decades. The method matters: instead of asking "how did the 1980s go?" it asks "how did every rolling one-year, three-year, ten-year… period go?" — which is the definition of a rolling return, a return measured over a fixed holding length but recalculated from many different start dates.
The result is a fairly clear map of where risk lives. Over single-year periods, investors lost money nearly one time in five. Stretch the holding period to three years, and roughly one in eight starting points still ended in a loss — and some of those losses were severe. The worst three-year stretch on record, 2000 through 2002, lost an average of 14.47% per year; a $10,000 investment held through that window would have shrunk to about $6,257. Anyone who needed that money on a fixed date — tuition, a house down payment — could have been forced to sell into a loss of more than a third.
Push the horizon further out, and the picture changes materially. Ten-year holding periods succeeded 95% of the time in this dataset, with the two exceptions belonging to investors who bought near the peak of the late-1990s bubble and then lived through both the dot-com crash and the 2008 financial crisis inside the same decade. Go one step further: no 15-year, 20-year, or 30-year period in this 50-year sample ended in a loss. A separate long-run dataset extending back to 1928 reaches a similar conclusion for 20-year windows specifically.
The shrinking range of outcomes
The absence of a loss is only half the story. The other half is that the range of plausible outcomes — the gap between the luckiest and unluckiest investor — narrows sharply as the holding period lengthens. The table below translates the rolling-return data into what actually happened to a hypothetical $10,000.
| Holding period | Historical share of periods with a loss | Worst annualized return | Best annualized return | $10,000 at the worst starting point |
|---|---|---|---|---|
| 1 year | ~20% | Deeply negative in crash years | Sharply positive in rebound years | Well below $10,000 |
| 3 years | ~12% | −14.47%/yr (2000–2002) | +30.85%/yr | ~$6,257 |
| 10 years | ~5% (2 of 42 windows) | Modestly negative | Strongly positive | Below $10,000, but only barely and rarely |
| 15 years | 0% in this sample | +4.19%/yr | +18.80%/yr | $18,518 (2000–2014) |
| 20 years | 0% in this sample | Positive | Positive | $29,543 (1999–2018) |
| 30 years | 0% in this sample | Positive, ~4-point spread vs. best | Positive | $154,335 (1993–2022), vs. $460,979 at the best starting point |
Two patterns stand out. First, the floor rises: a devastating one-year loss gradually turns into a modest annual gain by the 15-year mark, even at the worst possible starting point. Second, the ceiling and floor converge: by the 30-year mark, the difference between the luckiest and unluckiest investor was about four percentage points of annual return — a much smaller gap than the swings visible at the one-year horizon. A separate long-history dataset going back to 1871 makes the same point even more starkly at the extremes: one-year rolling returns have ranged from roughly −62% to above +139%, while the worst 30-year rolling return on record has still been positive.
Why time changes the equation
None of this means the market becomes "safe" as time passes — it means the market has had more opportunities, historically, to recover from a bad start before an investor needed the money back. The logic runs in one direction, not a cycle:
flowchart TD
 A[Short-term price swings are unpredictable] --> B[A downturn near the start can force a loss if you must sell]
 B --> C[Longer holding periods give downturns time to be followed by recoveries]
 C --> D[Best- and worst-case annualized returns converge]
 D --> E[Historically lower — not zero — odds of a net loss]
This is the mechanical reason the loss-frequency numbers fall as the horizon lengthens: a crash that devastates a one-year return becomes, statistically, just one bad patch inside a longer sequence that includes recoveries. It is also why the 2000–2002 collapse, brutal for a three-year investor, barely dents the record for a 30-year investor who started in the early 1990s.
Why the average return can mislead
A single average annual return — "stocks return about 10% a year" — is true as a long-run summary and misleading as a planning tool, because almost no individual year looks like the average. One reference dataset spanning 1928–2025 puts the long-run nominal average near 10%, with inflation cutting that to roughly 6.9% in real, purchasing-power terms. Dividends are a meaningful part of that headline number, not a rounding error — over long stretches they have historically contributed close to half of total stock returns, which is one reason total-return figures (dividends reinvested) look so different from bare price-index figures.
The average also hides dispersion. Returns between −10% and +30% cover the majority of individual years, but the specific year an investor experiences is unknowable in advance. That is precisely the mechanism behind the loss frequency in the table above: an investor who happened to hold for exactly one bad year sees a result nothing like the smooth long-run average, while an investor who held for thirty years effectively absorbs many good and bad years into one number.
The caveat that changes for retirees
Everything above describes an investor who is accumulating and can choose when to buy, not one who must sell on a schedule. That distinction matters enormously for retirees making regular withdrawals. Sequence-of-returns risk — the danger that the order of returns, not just their average, damages a portfolio — can produce wildly different outcomes for two retirees with identical long-run average returns, depending on whether the bad years land early or late in retirement. This is a genuinely different risk from the one this article has been describing, and it is why a cash cushion covering near-term expenses is a common tactic: it lets a retiree avoid selling stocks into a downturn like 2000–2002, buying time for the rest of the portfolio to recover.
What patience changes, and what it doesn’t
The historical record here suggests a specific and modest lesson, not a sweeping one: the probability of a loss has tended to fall, and the range of plausible outcomes has tended to narrow, as the holding period lengthens across this 50-year U.S. sample. It does not prove that a 20-year or 30-year loss is impossible going forward, only that none appeared in the periods examined. It says nothing definitive about non-U.S. markets, small companies, or a portfolio that mixes stocks with other assets. And it says nothing about your personal tax bill, fees, or the year you might need to start withdrawing.
What it does offer is a corrective to a common and costly error: judging a twenty-year retirement plan by the feel of last year’s headlines. The mistake isn’t believing stocks can be risky — they can be, especially for money needed soon. The mistake is applying a one-year risk assessment to a decision that was never a one-year decision.