Market Risks

Explanations of volatility, drawdowns, liquidity, currency, and systemic risks in financial markets. These articles show why risk cannot be reduced to zero and how different types of risk appear in practice.

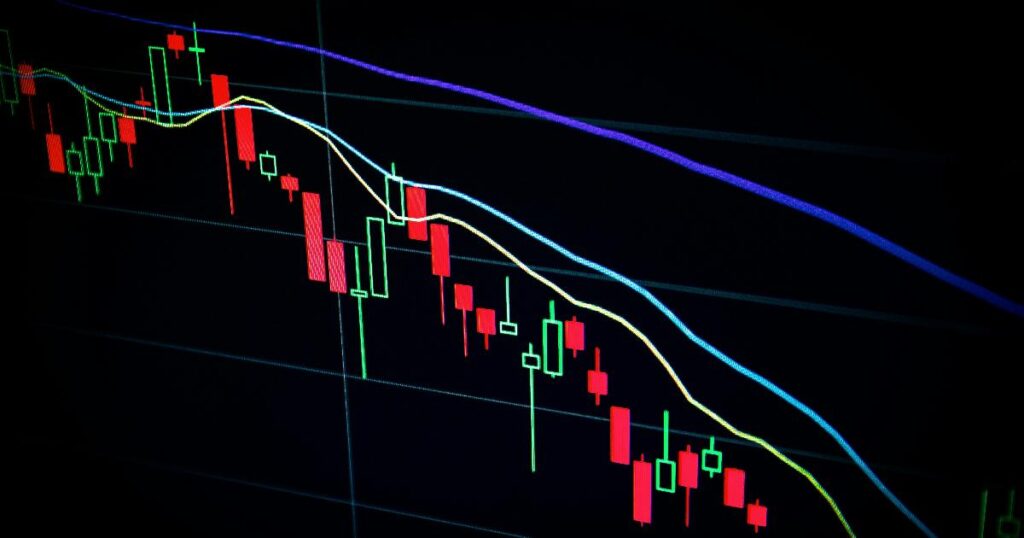
A stock chart dropping sharply on a monitor, illustrating the stock market crash risk despite a stable economy
Market Risks

Why a Calmer Economy Still Can’t Save Stocks From Crashing

A market can feel unusually forgiving for years — fewer recessions, faster policy fixes, more information reaching more people in less time — and still deliver the kind of gut-punch decline that makes headlines. That combination confuses a lot of investors, because it seems to contradict itself. If the economy is sturdier and traders can react instantly to bad news, shouldn’t the market simply glide upward with the occasional dip, rather than the occasional crash? The evidence says no, and the reason has less to do with economics than with what stocks are actually for.

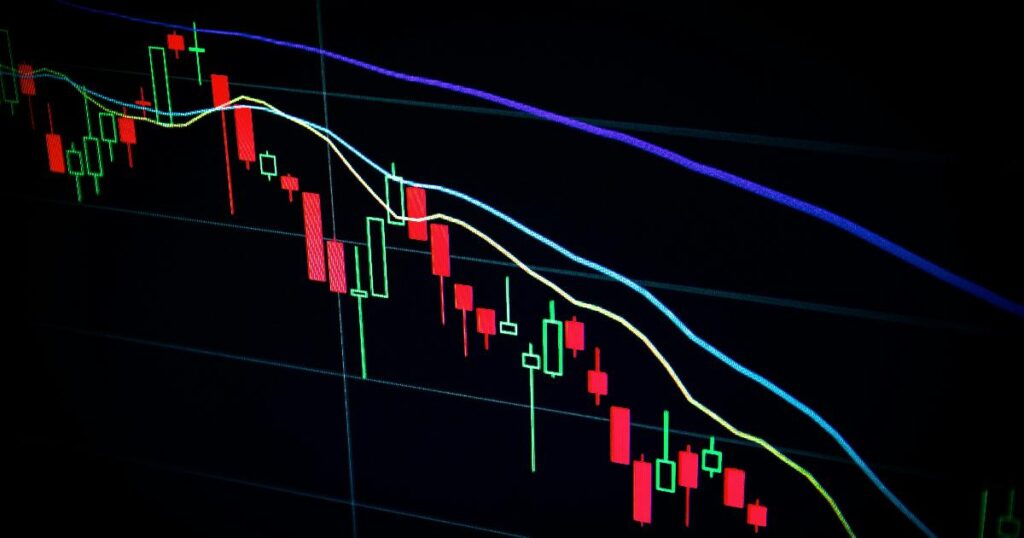
A dividend growth investing chart beside a falling portfolio value graph, illustrating the focus keyword phrase
Market Risks

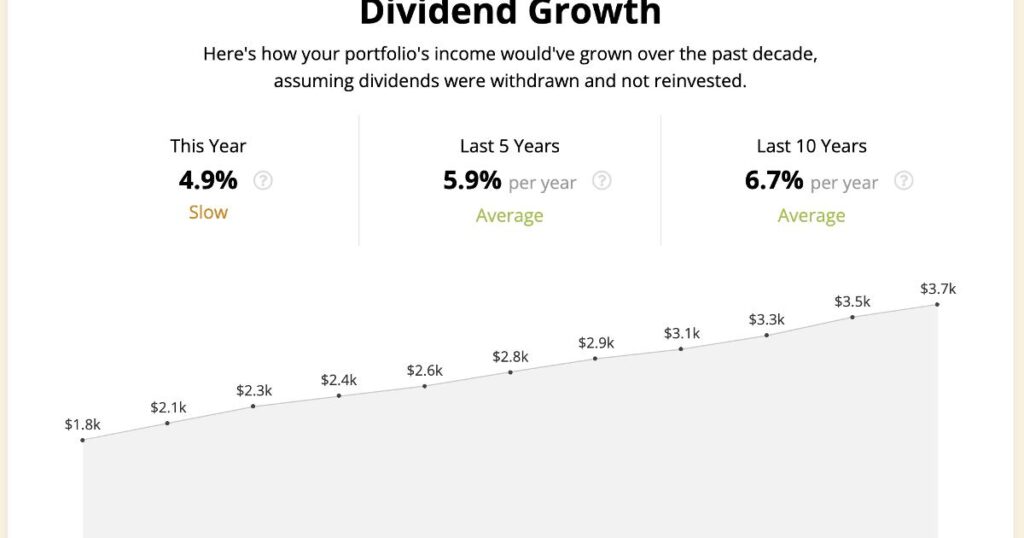
When a Growing Dividend Check Can Still Hide a Shrinking Portfolio

A rising dividend feels like proof that things are going well: more cash landing in the account, seemingly without you doing anything. But the comfort of a growing income stream and the safety of a portfolio are two different things, and confusing them is one of the quieter risks in investing today.

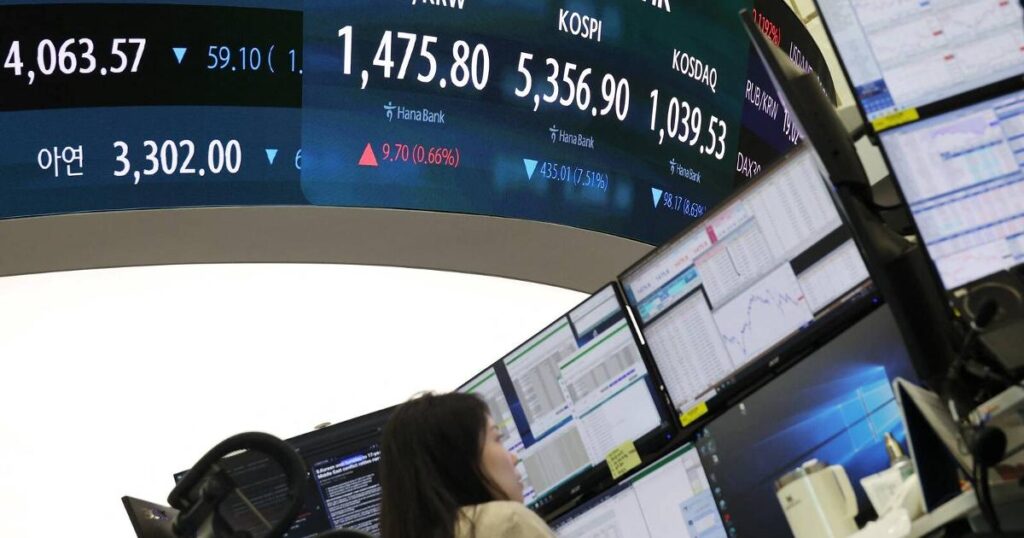
South Korean stock exchange display showing sharp market swings, illustrating hidden market risk behind a calm index
Market Risks

The Calm Index, the Wild Stock: What South Korea’s Crash Reveals About Hidden Market Risk

Imagine an index that gains 40% in dollar terms this year, ranks as the world’s best-performing major market, and still manages to erase nearly four decades of gains in five weeks. That is not a hypothetical. It happened in South Korea in 2026, and it happened while the country’s benchmark, the KOSPI, was busy being one of the year’s standout success stories. The lesson is not that South Korean stocks are uniquely dangerous. It is that a headline index number can tell you almost nothing about the risk sitting underneath it.

A calendar beside a stock chart illustrating how the worst year in the market changes with a longer time horizon
Market Risks

What a $10,000 Investment’s Worst Year Reveals About Time in the Market

Imagine two investors, each putting $10,000 into the S&P 500. One starts in 1982, at the dawn of an 18-year bull run. The other starts in 2000, at the peak of the dot-com bubble. Judged after twelve months, their results look like they belong to different asset classes — one investor is comfortably ahead, the other has watched a chunk of their money evaporate. Judged after thirty years, the gap narrows into something far less dramatic: both investors end up richer, even if by very different amounts. That contrast is the real subject of this article, and it points to a distinction many investors blur — the difference between short-term volatility and long-term investment risk.

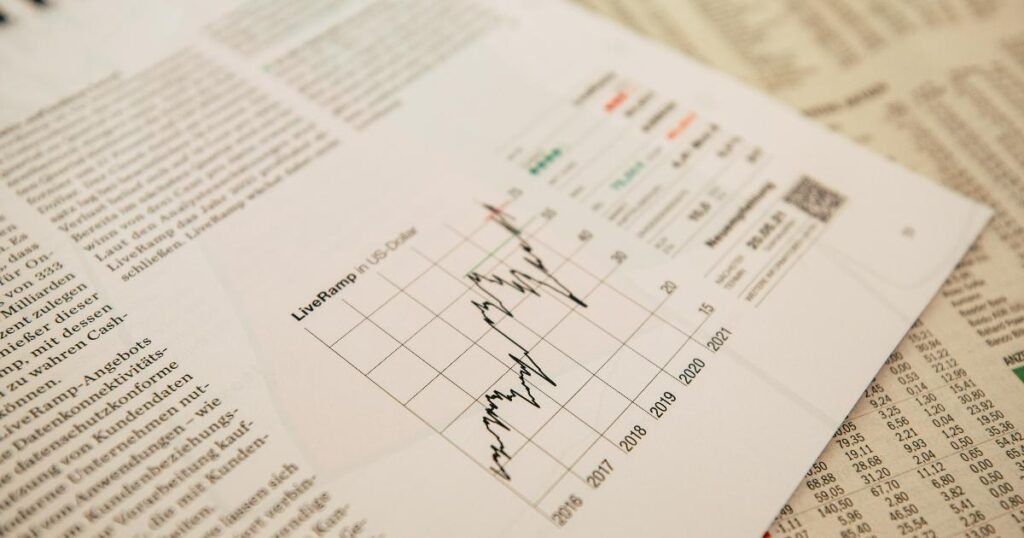
A stock market chart beside newspaper headlines showing market risk and investor discipline
Market Risks

When the Headlines Scream and the Market Shrugs: Lessons From 2026’s First Half

If you had read only the news in the first six months of 2026 — a war disrupting the world’s most important oil chokepoint, inflation jumping to a multi-year high, a new Federal Reserve chair upending communication norms — you might have guessed the stock market spent the period in retreat. Instead, the S&P 500 notched roughly two dozen record highs and returned over 10% including dividends. That gap between the tone of the headlines and the arithmetic of portfolio statements is not a fluke of 2026. It is a recurring pattern that says something important about how markets actually absorb risk, and it is worth understanding before the next scary headline arrives — because there will always be one.

Scroll to Top