A market that doubled, then didn’t
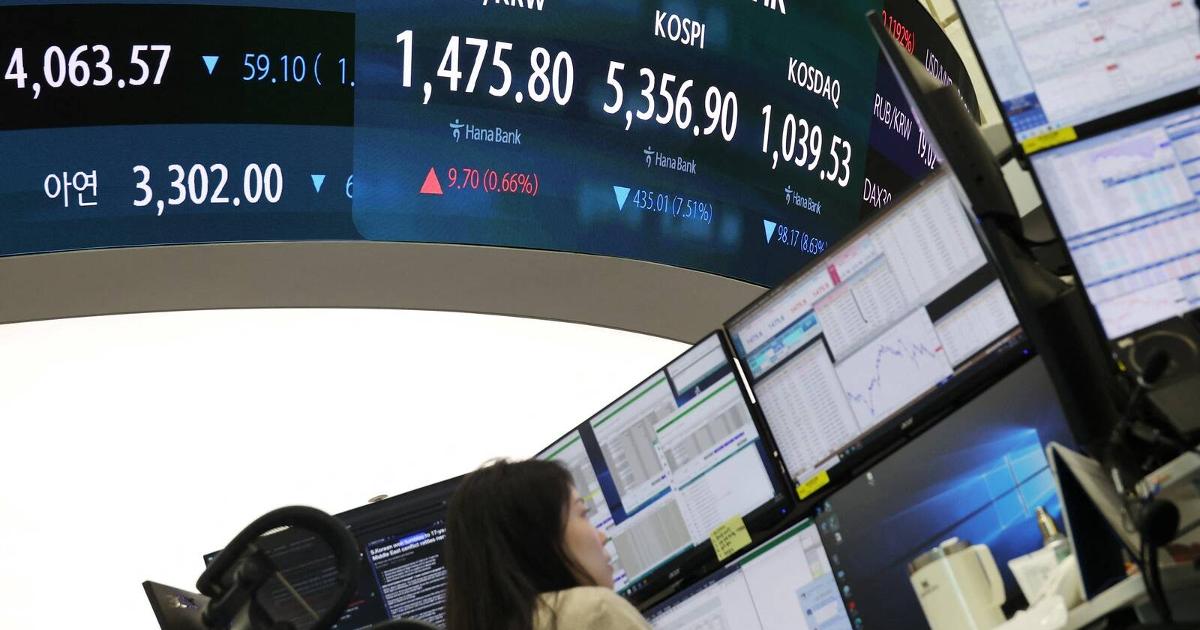
Earlier this year, the entire South Korean stock market more than doubled in under six months. Then it crashed more than 40% in about five weeks, before opening one Friday up over 13%. That is not a typo-worthy exaggeration; it is the kind of swing normally associated with a single speculative stock, not the seventh-largest equity market on earth. By late July, the plunge had wiped roughly $2.18 trillion off the value of South Korean equities in two sessions alone, putting the market on pace for its steepest monthly drop on record, even as the KOSPI remained up more than 41% year-to-date in dollar terms.
Two ingredients explain how a market can look strong on the calendar-year chart and still stage a near-halving in a matter of weeks. First, concentration: SK Hynix and Samsung together make up roughly half of the KOSPI, and both companies sit near the center of the global AI chip supply chain. When a market’s fate rides on two related companies, the index stops behaving like a diversified basket of the national economy and starts behaving more like a leveraged bet on one theme. Second, leverage: South Korean regulators had allowed single-stock leveraged ETFs on these very names, and lawmakers later argued that concentrated trading in those products made the market’s swings sharper than in comparable global markets.
The proximate trigger for the July rout was concrete — SK Hynix reported weaker-than-expected earnings, which reignited doubts about how far the AI investment boom could run and set off accelerated retail selling, triggering market-wide circuit breakers for two straight days. Societe Generale’s head of Asia equity strategy summed up the pattern bluntly: the stocks falling hardest were "the stocks in which you have the most leverage". None of this proves leverage caused the entire episode on its own — earnings disappointments, shifting AI expectations, and ordinary profit-taking after a huge run all played a role. But it is notable that the piece regulators moved fastest to address was the leverage, not the earnings.
When officials admit the product was the problem
What makes this episode more than an interesting chart is that South Korea’s own government effectively conceded the point. Finance Minister Koo Yun-cheol apologized to lawmakers for approving single-stock leveraged ETFs in the first place, saying the products "had not been considered carefully enough". Within days, the finance ministry announced it would pursue caps limiting how much of an investor’s portfolio could sit in these instruments — citing a potential ceiling around 20% of total investment — along with higher trading costs designed to discourage excessive activity, and a legal basis for emergency market-stabilization steps modeled partly on Hong Kong’s approach.
Lawmakers went further in public hearings, with one opposition legislator telling the minister the market had "turned into a casino" and calling the approval of two-times leverage on a market dominated by two stocks a policy failure. Whatever one thinks of that framing, it is a striking admission from officials, not outside critics, that a specific financial product amplified how violently prices moved in both directions. It’s worth being precise about what this does and doesn’t establish: it shows regulators judged leverage to be a meaningful contributor to the volatility, not that leverage was the sole cause, and not that the new curbs will prevent future episodes of this kind.
The same fingerprint, far from Seoul
If South Korea’s swings were purely a local story, they would be a curiosity. What makes them relevant to almost any investor is that the same fingerprint — huge run-up, a stock-specific catalyst, then a violent reversal — has shown up across AI-linked names elsewhere, even while broad U.S. and international indices have looked comparatively calm, up around 10% and 13% respectively so far this year.
SanDisk offers an extreme illustration. At one point in late June, the stock was up more than 5,300% over the previous twelve months — a number that is difficult to process even in an era of AI enthusiasm. It then fell nearly 60% in four weeks, before jumping 26% in a single day. IBM, a company that has been publicly traded for more than a century, posted its worst single-day decline in its history after an earnings miss. On one Thursday, a cluster of previously beaten-down chip and tech names — Microsoft, Western Digital, Micron, SK Hynix — each rose double digits in a single session, having fallen sharply beforehand. The very next trading day, Apple, Roblox and Reddit dropped hard while Amazon jumped 15%. None of these are small-cap curiosities; they are widely held, heavily traded names, and the swings happened within an index environment that, on the surface, looked orderly.
Reading the market at two levels
The practical problem for an individual investor is that the headline index and the underlying reality can diverge enough to make the index actively misleading about risk. The table below separates the two layers.
| What you see at the index level | What can be happening underneath |
|---|---|
| Steady, moderate annual return (e.g., broad market up roughly 10–13% this year) | A handful of megacap or single-theme stocks driving most of that return |
| Low measured index volatility | Individual constituents swinging 20–60% within weeks, in both directions |
| A "diversified" national or sector benchmark | Effective concentration in two or three names tied to one narrative (here, AI chips) |
| Orderly trading, few circuit breakers | Leveraged products amplifying moves and forcing rapid position unwinds |
| A market that "recovered" after a drop | A prior 40% drawdown that mathematically requires a much larger subsequent gain just to break even |
That last row is worth dwelling on. A drawdown is simply a decline from a prior peak, but the math is asymmetric: an asset that falls 40% needs to rise about 67% just to get back to where it started. A market or stock can be "up on the year" while an investor who bought near the peak is still sitting on a painful loss — precisely the position many South Korean retail traders using leveraged products found themselves in.
How a crowded trade turns into a fast reversal
The mechanism connecting enthusiasm to a violent reversal follows a recognizable sequence, even though the specific trigger differs each time.
flowchart TD
 A[Optimism concentrates in a few AI-linked names] --> B[Leverage amplifies gains]
 B --> C[Prices detach from near-term fundamentals]
 C --> D[A catalyst disappoints expectations]
 D --> E[Leveraged positions face margin pressure]
 E --> F[Forced selling accelerates the drop]
Each step is individually unremarkable — optimism, leverage, a disappointing earnings report, forced selling are all familiar market ingredients. What changes the outcome is speed. When leverage is concentrated in a small number of related stocks, the unwind at the end of the chain can happen in days rather than months, which is exactly what separates a normal correction from the kind of five-week, 40% air pocket South Korea experienced.
What this means for a long-term investor
None of this is a signal to abandon equities, nor evidence that AI-linked chipmakers are now cheap or expensive — the sources here describe what happened, not what happens next. It’s also worth resisting the temptation to treat South Korea as a preview of what will happen to the S&P 500 or any other market; its structure — with two stocks commanding roughly half the index and newly permitted single-stock leverage products — is unusual, not universal. What the episode does offer is a checklist. Before treating a calm index return as evidence of a calm market, it is worth asking how much of that return comes from a small number of stocks, whether those stocks share a common narrative, and whether leveraged products have become popular in that corner of the market. A diversified, long-term portfolio is still one of the more reliable ways to participate in the stock market’s wealth-building power. But "diversified" is a claim that deserves verification, not an assumption that a low index-level volatility number confirms on its own.