
volatility

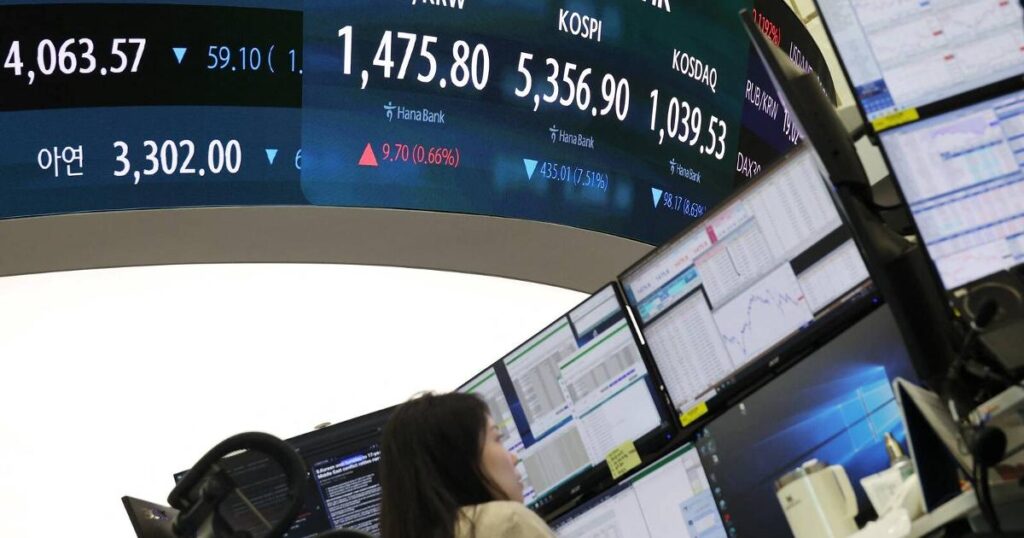
South Korean stock exchange display showing sharp market swings, illustrating hidden market risk behind a calm index
Market Risks

The Calm Index, the Wild Stock: What South Korea’s Crash Reveals About Hidden Market Risk

Imagine an index that gains 40% in dollar terms this year, ranks as the world’s best-performing major market, and still manages to erase nearly four decades of gains in five weeks. That is not a hypothetical. It happened in South Korea in 2026, and it happened while the country’s benchmark, the KOSPI, was busy being one of the year’s standout success stories. The lesson is not that South Korean stocks are uniquely dangerous. It is that a headline index number can tell you almost nothing about the risk sitting underneath it.
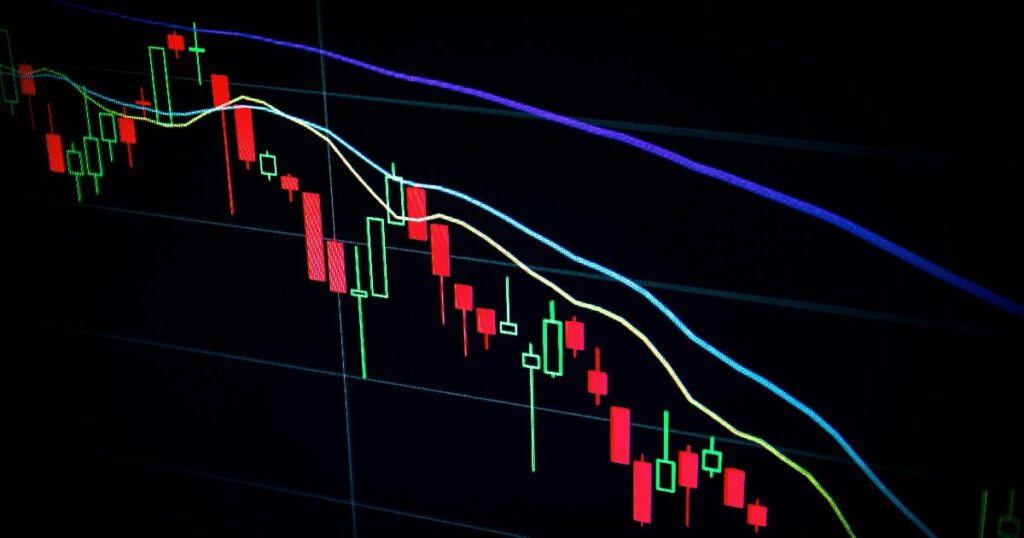
A century of U.S. stock returns shown as a chart, highlighting how the average hides wide volatility and uneven compounding
Market History

A Century of U.S. Stock Returns: Why the Average Hides More Than It Reveals

Imagine buying U.S. stocks at some random moment over the past hundred years and then asking a simple question: what actually happened next? Not on average, not in theory — what happened to your money over the following month, year, decade, or two? The honest answer is unsettling for anyone who likes tidy numbers: it depends enormously on which “next” you’re asking about, and the single average return figure that gets quoted in almost every retirement calculator obscures that fact almost completely.

Scroll to Top