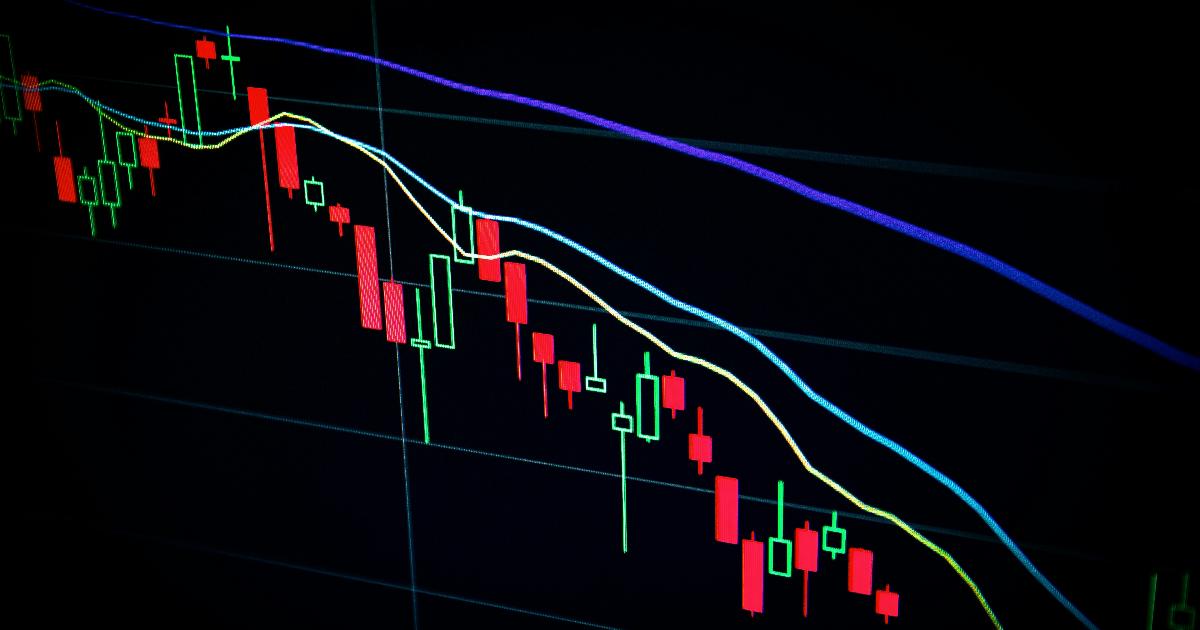
The anxiety has an obvious trigger. Markets are sitting near record levels at the same time households are absorbing high prices, rising borrowing costs, and persistent questions about whether the enormous spending on artificial intelligence will pay for itself. Kelly LaVigne of Allianz Life, discussing the survey findings, called it "almost opposite headlines" — a market setting records while the cost of living still stings. That tension is real. It just isn’t a timing signal.
Sentiment is not a forecast
Nearly two-thirds of Americans told the same survey they feel pressured to delay financial decisions because the economy feels too unpredictable to act on. That’s a coherent emotional response to conflicting news, but it conflates two very different things: how people feel about the market and what the market is actually likely to do next. Fear surveys measure mood, not probability. They tend to spike after a market has already risen a long way, which means by the time "everyone" expects a correction, the warning has usually been circulating for a while without one arriving — or, just as often, without warning of the one that does.
Record highs themselves are not unusual. Over long stretches of market history, indexes spend a notable share of their time near new peaks simply because the long-run trend of corporate earnings and prices is upward. A new high is a description of where the price is, not a prediction of where it is going next.
What the valuation signal can and can’t do
Investors looking for a more rigorous reason to worry often point to the cyclically adjusted price-to-earnings ratio, or CAPE, which smooths a decade of earnings to control for business-cycle swings. The ratio is near its second-highest level on record, trailing only its reading just before the dot-com crash. Ron Johnson, a wealth planner at Baird, offers a blunt summary: "We know it’s coming but we don’t know when" — and that gap between knowing a correction will eventually happen and knowing when is the whole problem.
Research on CAPE and related valuation measures supports Johnson’s caution in both directions. Higher starting valuations have historically been followed by lower average returns over the subsequent decade, and the worst-case outcomes from expensive starting points have been worse than the worst cases from cheap starting points. That’s a genuine, well-documented relationship. But the dispersion around that average is wide — a high CAPE reading has still been followed by a wide range of outcomes, including some healthy ones, and a low CAPE reading has still been followed by some disappointing ones. Studies that have specifically tested whether valuation measures can be used to time shifts between stocks, bonds, or regions have found the results "lackluster" compared with simply holding a diversified allocation. In plain terms: CAPE is a reasonable tool for setting expectations about returns over many years. It is a poor tool for deciding when to get out, or when to get back in.
The behavioral trap: going to cash at the wrong moment
If valuation anxiety is hard to act on precisely, the temptation it creates is easy to act on badly: selling equities and sitting in cash until things feel safe again. LaVigne’s warning is direct — pulling money out after a downturn "only makes recovering harder," and the behavior itself, not the market’s performance, is what erodes long-term results for individual investors.
The data on missing strong market days illustrates why. Looking at the 20 years from 1999 through 2018, an investor who stayed fully invested in the S&P 500 saw their return cut roughly in half simply by missing the ten single best days in that two-decade span — a tiny fraction of the thousands of trading days involved. A separate look at 2003 through 2018 found a similar pattern: full investment returned 7.7% annualized, but missing just the ten best days dropped that to 2.65%. The uncomfortable detail is that many of those best days cluster right around the worst ones — in one case, the best trading day of a given year came just two days after the worst. An investor who exits after a frightening drop is statistically likely to be out of the market precisely when some of the recovery’s biggest gains occur. None of this means markets can’t fall further from here, or that today’s highs are safe. It means that trying to dodge the fall by stepping out entirely carries its own, well-documented cost.
Turning crash talk into a decision, not a reaction
The useful response to crash anxiety isn’t a prediction — it’s a process that separates emotion from structure. A headline about an "unsustainable" market should prompt questions about one’s own time horizon and liquidity, not an automatic reallocation.
flowchart TD
 A[Read crash headline] --> B[Check time horizon for the money]
 B --> C[Confirm near-term cash needs are covered]
 C --> D{Portfolio already diversified?}
 D -->|Yes| E[No change needed]
 D -->|No| F[Rebalance toward target mix]
That sequence reflects what the financial planners cited in this reporting actually recommend: keep some portion of a portfolio in fixed income not because stocks are doomed, but so there is "powder in your keg to rebalance and buy equities at a low price" if a correction does occur. For those near or in retirement, advisors suggest shielding several years of planned living expenses — Thomas Martin of Globalt Investments frames it as a question of how certain you need the money to be, not a blanket cash target. For long-term savers still contributing, the advice is simpler: keep contributing through a downturn, since consistent dollar-cost averaging buys more shares when prices are cheaper — though this spreads risk over time rather than preventing losses outright.
The distinctions below separate the emotional reaction from the risk-management one:
| Signal | What it tells you | What it doesn’t tell you | Reasonable response |
|---|---|---|---|
| Crash-fear survey | Current investor mood | Timing or probability of a decline | Treat as noise, not a trigger |
| High CAPE ratio | Lower average expected long-term returns | When any pullback would start | Revisit long-term return assumptions |
| Market volatility | Prices can move sharply either way | Which direction comes next | Confirm near-term cash is already protected |
| Urge to sell everything | Discomfort with uncertainty | Whether selling improves outcomes | Pause; check against your written plan |
The bottom line
Nothing in this reporting establishes that a crash is imminent, that today’s CAPE level guarantees a repeat of 1929 or 2000, or that any particular asset will prove a safe haven if a downturn does arrive. What the evidence does support is narrower and more actionable: valuations run in cycles, markets occasionally correct by 10% or more and sometimes fall into bear-market territory of 20% or worse, and the investors who suffer the most durable damage are often the ones who converted a temporary decline into a permanent loss by selling at the bottom. Diversification and dollar-cost averaging won’t make losses disappear — they are tools for managing risk, not eliminating it. The three-quarters of Americans bracing for a crash may turn out to be right eventually; markets do fall. The more important fact is that their fear, however widely shared, doesn’t tell anyone when — and a portfolio built to survive volatility shouldn’t depend on guessing that answer correctly.
This article is for educational purposes and does not constitute investment advice. Past market patterns do not reliably predict future results, and the appropriate cash reserve or asset mix depends on individual circumstances.