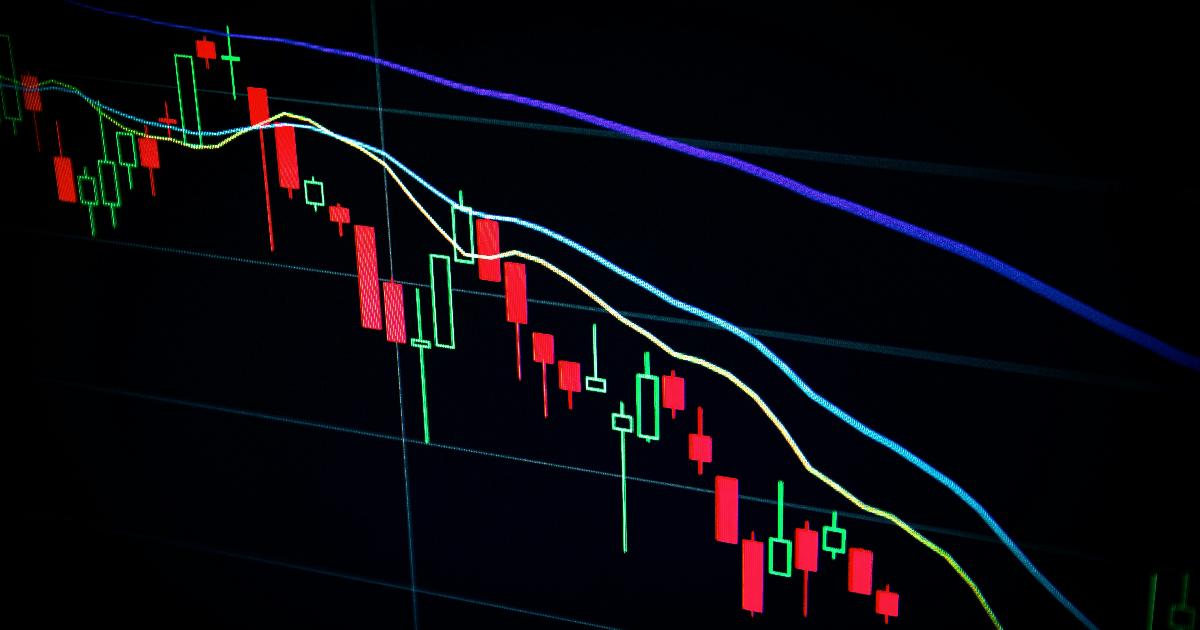
A single day, several cliff-dives
On October 29, 2026, a cluster of large technology and software names fell by double digits within hours of each other. Intel dropped a combined 25.8% between regular trading and after-hours action, closing near $70.87 — a stock that had been at $142 just months earlier and $20 a year before that. Amazon fell 11%, split between a 4.2% regular-session decline and a 7.3% after-hours slide, even though its cloud unit, AWS, grew revenue 39% and operating income 55%, both ahead of expectations. Alphabet lost 13.3% combined, erasing more than $500 billion in market value, despite revenue growing 25% for the quarter. ServiceNow fell 27% after raising its full-year outlook — just not by enough. Reddit dropped 21.3% even though its quarterly results beat expectations, with the stock reacting instead to softer fourth-quarter guidance and a warning from its own CEO that AI search features were cutting into the referral traffic it depends on.
Notice the pattern: in several of these cases, the headline numbers were not disasters. Revenue grew. In some cases profit lines beat forecasts. Yet share prices behaved as if the news were uniformly bad. That gap — between what the income statement says and what the stock does — is the actual subject of this article, and it is worth understanding on its own terms rather than as a verdict on any single company’s future.
Separating the business from the stock
It helps to keep two different questions apart: "Is this company’s underlying business getting weaker?" and "Is this stock’s price falling?" They are related, but not the same thing. A company’s market capitalization is simply the price the market is currently willing to pay for its future profits, multiplied by its share count — it is not a reserve of cash sitting in a vault. When that figure drops by tens or hundreds of billions in a day, it mainly reflects a change in collective willingness to pay, not a change in the company’s assets or operations. A stock can fall sharply even while revenue and profit are still rising, if investors had been pricing in results well above what was actually delivered.
That is largely what happened here. In most of these cases, the disappointment was relative — relative to analyst estimates, relative to guidance investors had hoped for, relative to the growth rates that had justified sky-high valuations in the first place. Intel’s quarter technically beat on headline earnings, but weak guidance for its PC business and softer-than-hoped outlook commentary were enough to trigger the rout. Alphabet’s earnings-per-share miss was driven by securities holdings, not core operations, while search-advertising growth of 12% — slower than hoped, and amid chatter that AI tools are eating into search traffic — became the focal point of investor anxiety.
Why after-hours moves look so violent
Several of these declines were split between the regular trading session and after-hours trading, and the after-hours portion was often larger. That is not a coincidence. Regular trading hours bring in the broadest pool of buyers and sellers, which tends to cushion sudden moves. After the closing bell, far fewer participants are active, order books are thinner, and a wave of selling (or buying) has less to absorb it. The same volume of sell orders that might move a stock modestly at 2 p.m. can move it dramatically at 5 p.m., simply because there is less liquidity on the other side of the trade.
The mechanics of a crowded exit
The following table separates the distinct ingredients that can combine into a sharp post-earnings drawdown — useful because headlines tend to compress them into one simple "stock crashes" narrative.
| Driver | What it means | Why it can amplify a selloff |
|---|---|---|
| Reported results vs. expectations | Actual revenue/earnings compared with what analysts and investors had priced in | A "beat" relative to last year can still be a "miss" relative to inflated hopes |
| Forward guidance | Management’s outlook for coming quarters | Soft guidance often matters more to price than the quarter just reported |
| Valuation level | How expensive the stock was before the report, relative to earnings or growth | Richly priced stocks have less room for error and more room to fall |
| Positioning / crowding | How many investors already own the stock, expecting further gains | When many holders try to sell simultaneously, there are few buyers left to absorb it |
| Market liquidity | How many active buyers and sellers are present at the time of the move | Thin after-hours liquidity turns moderate selling into outsized price drops |
No single row "causes" a selloff like this one; it is usually the combination that does the damage.
The same logic shows up as a sequence, not just a list:
flowchart TD
 A[Stock priced for perfection] --> B[Earnings report has a wrinkle]
 B --> C[Guidance or detail disappoints]
 C --> D[Early holders start selling]
 D --> E[Crowded positioning accelerates the exit]
 E --> F[Thin after-hours liquidity amplifies the drop]
What this episode does and doesn’t tell us
It would be a mistake to read these declines as proof that an "AI bubble" has burst, or that Intel, Amazon, Alphabet, ServiceNow, Fortinet, or Reddit are fundamentally broken businesses based on one earnings report. AWS’s growth, Alphabet’s 25% revenue increase, and ServiceNow’s raised guidance don’t support that conclusion. It would be equally wrong to treat these moves as a reliable signal for predicting the next earnings season — a stock that got hammered once can behave very differently the next time, and these sources offer no basis for forecasting that. What the day does illustrate is a mechanism: when ownership is concentrated, expectations are stretched, and valuations leave little room for anything short of spectacular, even a modest shortfall can trigger a scramble that overwhelms thin liquidity and produces a move far larger than the news itself would seem to warrant.
The takeaway for long-term investors
None of this means every richly valued, widely owned stock is doomed to crash on its next report. It does mean that owning popular, expensive stocks carries a specific kind of risk that isn’t visible in steady, gradual price charts: the risk of abrupt repricing when "good" quietly fails to meet "spectacular." Understanding that distinction — between a business deteriorating and a market recalibrating its appetite for risk — is the first step toward evaluating these kinds of selloffs with clear eyes rather than reflexive panic or reflexive bargain-hunting. This is an explanation of a market mechanism, not a forecast of what any of these stocks will do next, and past selloffs offer no guarantee about how future earnings reactions will unfold.