That distinction matters more than usual right now. Critical materials ETFs — funds that bundle miners and processors of lithium, copper, rare earths, gallium, and germanium — have moved from a niche allocation for commodity specialists into mainstream diversification advice, pitched as a way to combine inflation protection with exposure to "the energy transition." The pitch is not baseless: these metals genuinely sit at the center of decarbonization and the AI buildout. But the demand forecasts underpinning that pitch are not single numbers. They are ranges, built on assumptions about climate policy, battery chemistry, and geopolitics that are inherently unstable — and the marketing materials investors actually see tend to show only the top of the range.
A Fund Built on a Promise, Not a Number
The Sprott Critical Materials ETF (SETM) is a useful case study precisely because it is a plain, current example of how this pitch is made. Since its February 2023 launch, the fund has grown to $654 million in assets and 156 holdings, and its net asset value has risen 7.95% year-to-date as of the end of July 2026. Sprott’s own marketing frames this performance as validation of a broader thesis: that critical materials offer both defensive characteristics — inflation resilience, diversification — and offensive ones, tied to what it calls a "crucial long-term investing opportunity" in energy.
Steve Schoffstall, Sprott’s head of ETFs, put the underlying logic directly in a recent interview: "When you look at the underlying demand for a lot of these critical materials, it’s actually done nothing but get stronger over the last 12 to 24 months". That is a defensible read of recent price and balance-sheet trends among miners. It is a different claim, though, from saying that the demand trajectory implied by "energy transition" is well-defined enough to underwrite a multi-decade investment thesis. The fund’s own literature cites a single figure — electricity demand rising 157% by 2050 under the IEA’s net-zero scenario — without noting that this is the aggressive end of a published range, not a consensus forecast.
Two Forecasts, One Mineral, Wildly Different Futures
The International Energy Agency does not publish one number for future mineral demand; it publishes several, precisely because the outcome depends on choices that haven’t been made yet. Its Stated Policies Scenario (STEPS) models a world where governments follow through on announced policies but nothing more. Its Sustainable Development Scenario (SDS) models a world aligned with aggressive climate targets. The gap between them, by 2040, is not a rounding error.
Under STEPS, total mineral demand from clean energy technologies roughly doubles by 2040. Under SDS, it roughly quadruples. For electric vehicles and battery storage specifically — the single largest driver of demand growth in both scenarios — mineral demand grows tenfold under STEPS and more than thirtyfold under SDS.
Lithium illustrates just how sensitive these numbers are to assumptions that sit below even the STEPS/SDS split. The IEA estimates that 2040 lithium demand could be 13 times today’s level if vanadium redox flow batteries — an alternative chemistry — gain rapid market share within the modest-policy STEPS world, or 51 times today’s level if all-solid-state batteries commercialize faster than expected within the aggressive-policy SDS world. Cobalt and graphite show a similarly wide band, six to thirty times current demand, depending purely on which battery chemistry manufacturers settle on. Rare earths swing between three and seven-plus times current demand depending on whether wind turbine makers keep using permanent-magnet designs.
This is worth sitting with, because it exposes something the "long-term opportunity" framing glosses over: a 25-year-old buying SETM today and a 76-year-old doing the same are, in effect, making very different bets. The younger investor has a horizon long enough to plausibly capture the slow unfolding of a 2040-2050 demand curve, whichever scenario materializes. The older investor’s holding period is much more likely to be dominated by near-term price volatility — driven by supply shocks, interest rates, or sentiment — than by the eventual resolution of a scenario gap that plays out over fifteen-plus years. Both are holding the same fund, but they are not holding the same risk.
Why the Range Is So Wide — and Why It Won’t Narrow Soon
None of this uncertainty is a modeling flaw. It reflects the underlying non-linearity of how policy and technology translate into physical mineral demand: a modest shift in EV adoption rates or a breakthrough in battery chemistry doesn’t nudge demand a percentage point or two — it can shift a mineral’s trajectory by tens of percentage points over a decade, because deployment curves compound. That is structurally different from, say, forecasting demand for a mature consumer good with decades of stable historical data behind it.
McKinsey’s Global Materials Perspective frames this range slightly differently but arrives at the same conclusion, mapping three energy-transition pathways — Slow Evolution, Continued Momentum, and Sustainable Transformation — that produce materially different demand and price paths for copper, lithium, and rare earths through 2035. Whichever framework an analyst prefers, the throughline is the same: closing the gap between projected demand and available supply is estimated to require roughly $5.4 trillion in capital expenditure by 2035, and that capital only shows up if price signals and policy incentives justify it. McKinsey estimates copper prices would need to rise about 20% and lithium prices about 30% from 2024 levels just to incentivize sufficient new production — which means the supply side of this story is itself contingent on the same uncertain variables driving the demand side. Mining and processing companies, aware of this, have historically been reluctant to commit large capital to projects with sixteen-year average timelines from discovery to production when the demand they’re supposed to serve could be three or four times larger or smaller than currently expected.
None of this means demand growth is imaginary. Every published scenario — even the conservative one — shows critical mineral demand rising over the next fifteen years. What varies enormously is the magnitude, the timing, and which specific minerals benefit most. A portfolio decision that treats "critical materials will grow" as sufficient information, without asking which growth path is embedded in the price you’re paying today, is skipping the part of the analysis that actually determines whether the investment thesis holds.
The AI Vector Marketing Materials Rarely Mention
There’s a further complication that most ETF marketing built around "energy transition" and "battery metals" doesn’t fully capture: a second, largely separate demand driver has emerged from artificial intelligence infrastructure, and it points at different minerals than the ones typically featured in fund pitches.
Battery and grid narratives center on lithium, copper, nickel, and rare earths. AI chip and data-center demand centers heavily on gallium and germanium — minerals used in high-performance semiconductors and fiber optics that get comparatively little attention in retail-facing materials. FP Analytics estimates that AI-specific needs alone could push germanium demand up 37% and gallium demand up 85% by 2033, layered on top of whatever growth those minerals see from other uses. That’s a demand vector that barely existed in the models underpinning most critical-materials investment pitches even a few years ago.
It also concentrates risk somewhere marketing materials rarely dwell on. China controls roughly 98% of global primary gallium production and more than 60% of germanium refining. That concentration turns what looks like a demand story into a geopolitical one: FP Analytics cites a U.S. Geological Survey estimate that a 30% disruption in gallium supply could reduce U.S. GDP by more than 2% — around $600 billion — a macroeconomic shock that has nothing to do with whether long-run demand forecasts prove accurate. The risk isn’t hypothetical. Chinese export controls on gallium and germanium introduced in 2023, followed by expanded restrictions on rare earths through 2025, pushed prices for gallium outside China up 50–100% in some periods.
When a Price Spike Isn’t a Demand Signal
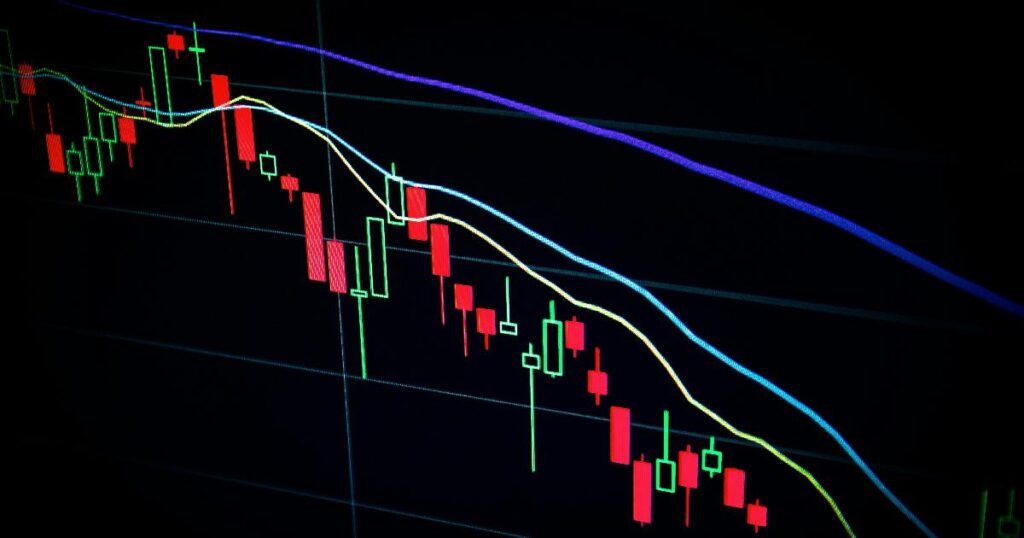
This is where investors most often mistake one kind of story for another. A critical materials ETF’s price can rise sharply because underlying demand forecasts have strengthened — or because a supply-side shock, like an export control, has made existing supply scarcer and pricier, with no change to the long-run demand trajectory at all. Both show up identically on a price chart. Only one of them tells you anything about whether the "energy transition opportunity" thesis is playing out as expected.
The 2023–2025 period offers a live example: gallium and germanium prices climbed as China tightened export rules, even as broader mineral prices — lithium fell roughly 75% from 2022 to 2023, cobalt, nickel, and graphite each dropped 30–45% — moved in the opposite direction on oversupply. A retail investor watching an ETF’s NAV rise 7.95% year-to-date has no easy way, from that headline number alone, to tell how much of the move reflects strengthening long-run demand assumptions versus a temporary geopolitical squeeze on one or two of the fund’s 156 holdings. Fund providers rarely break this apart for retail audiences, and it’s a fair question whether most advisors pitching these products do either.
Reading a Track Record That Is Barely Three Years Old
SETM’s cumulative NAV gain since its February 2023 inception — 85.95% through late August 2026 — is a genuinely striking number, and it’s easy to see why it anchors a marketing narrative. But three and a half years is a short window against demand curves that IEA and McKinsey model out to 2035 and 2040. A fund’s early performance during a period of tightening critical-minerals markets tells you something about how that specific stretch of time played out — commodity cycles, a handful of geopolitical shocks, general risk appetite — but it doesn’t validate which of the underlying demand scenarios is actually unfolding, because scenario divergence is designed to show up mostly in the later years of the forecast period, not the first three.
This is the core discipline the marketing conveniently skips: past returns describe what happened under one realized path of policy, technology, and geopolitics. They say very little about which of the many plausible future paths — a 13-times or 51-times lithium world, a STEPS or SDS rare-earths world, a world where AI mineral demand keeps compounding or plateaus — an investor is actually being asked to hold exposure to today.
Questions Worth Asking Before Allocating
None of this argues that critical materials have no place in a diversified portfolio, or that the underlying demand growth is fictitious — every credible published scenario shows growth, just at very different magnitudes. What it argues for is precision about what you’re actually betting on. Before allocating to a fund built on this thesis, it’s worth being able to answer, in your own words: which demand scenario does this pitch implicitly assume — the modest STEPS-style path or the aggressive SDS-style path — and is that assumption disclosed anywhere in the materials you were shown? What would have to happen, in policy or battery technology, to prove that assumption wrong within your own investment horizon? And how much of any recent price move reflects a geopolitical supply shock rather than a genuine shift in long-run demand?
The Bottom Line
Critical materials sit at a real intersection of decarbonization, electrification, and AI infrastructure, and it’s plausible that demand for many of them rises substantially over the next fifteen years under almost any policy path. But "substantially" is doing a lot of work in that sentence — the plausible range runs from roughly doubling to quadrupling in aggregate, and forty-fold or more for specific minerals like lithium under the most aggressive assumptions. A pitch that compresses that range into a single upward-sloping story, anchored to a headline growth statistic and a recent year-to-date return, isn’t lying — it’s omitting the part of the analysis that determines whether the thesis actually applies to your time horizon and your tolerance for the volatility that geopolitical supply shocks can introduce along the way. Past performance of SETM or any comparable fund doesn’t resolve that omission; it just shows you one realized outcome from one short stretch of an unresolved range. The decision about whether, and how much, to allocate belongs to you — but it should rest on knowing which scenario you’re actually buying, not on the shape of a chart.