
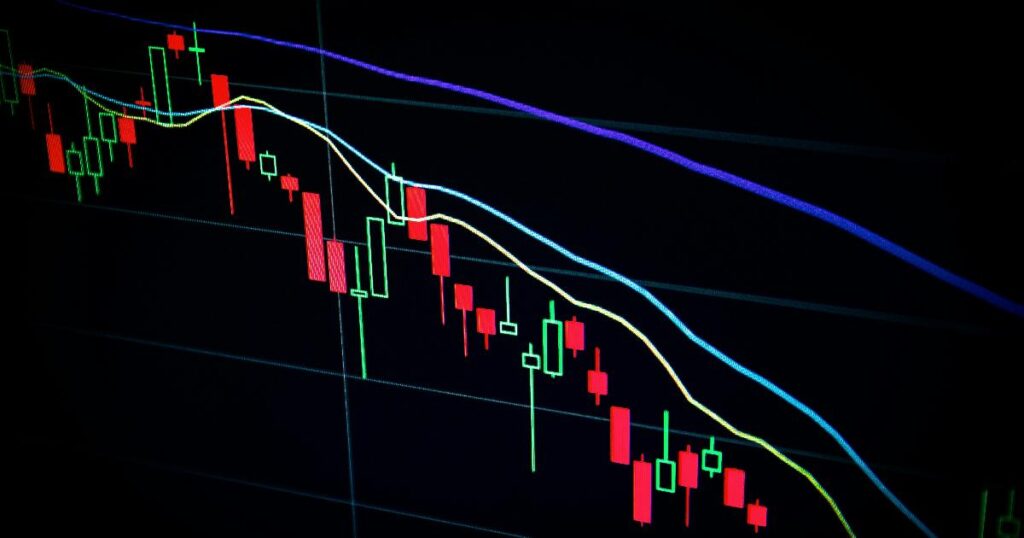
stock market history

A rising stock chart beside printed market data, illustrating how a 15-year win streak can affect future returns expectations.
Market History

What a 15-Year Win Streak Actually Tells Investors About the Future

If you’ve checked your portfolio’s long-term return lately and felt reassured, you’re not imagining the strength — you’re just looking at a number that’s unusually good by historical standards. The uncomfortable part isn’t that the recent run has been strong. It’s that history suggests strong runs eventually give way to weak ones, while offering almost no guidance on when that handoff happens.
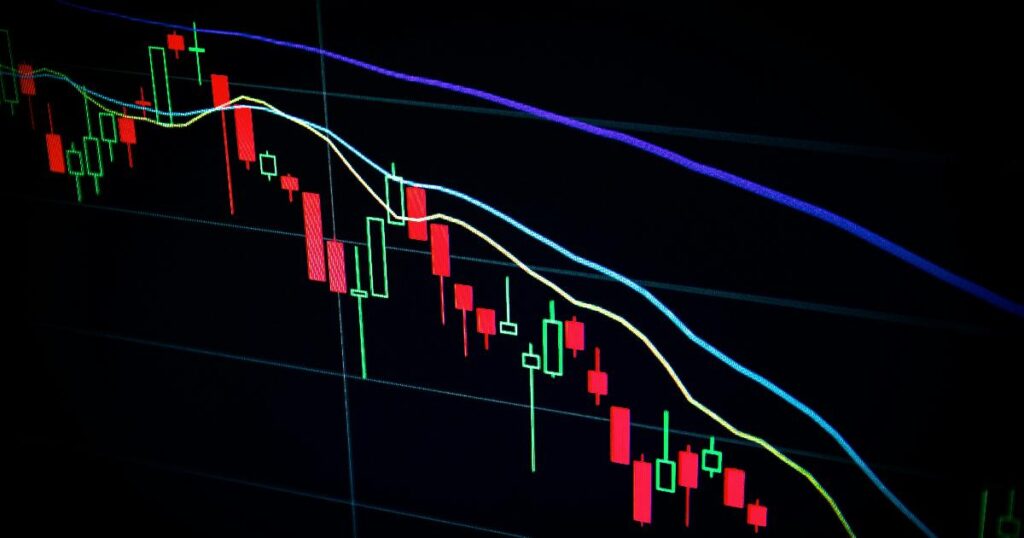
A chart showing stock market annual returns, illustrating how the 10% average return hides wide year-to-year variation
Market History

Why a 10% Average Return Tells You Almost Nothing About Any Single Year

If someone told you that the U.S. stock market has finished a given calendar year higher than it started roughly seventy-three times out of the last ninety-nine, you might reasonably conclude that stocks are a fairly comfortable bet. If someone then told you the long-run average annual return over roughly a century is about 10%, you might imagine a market that quietly compounds wealth every year, like a savings account with slightly better manners. Neither impression survives contact with the actual year-by-year record.

Scroll to Top