
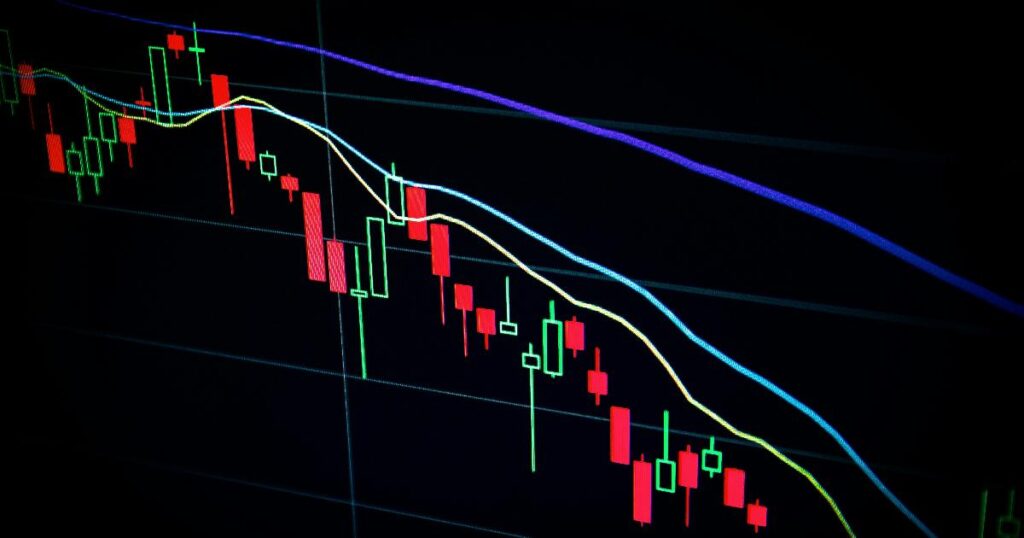
market volatility

A chart showing stock market annual returns, illustrating how the 10% average return hides wide year-to-year variation
Market History

Why a 10% Average Return Tells You Almost Nothing About Any Single Year

If someone told you that the U.S. stock market has finished a given calendar year higher than it started roughly seventy-three times out of the last ninety-nine, you might reasonably conclude that stocks are a fairly comfortable bet. If someone then told you the long-run average annual return over roughly a century is about 10%, you might imagine a market that quietly compounds wealth every year, like a savings account with slightly better manners. Neither impression survives contact with the actual year-by-year record.
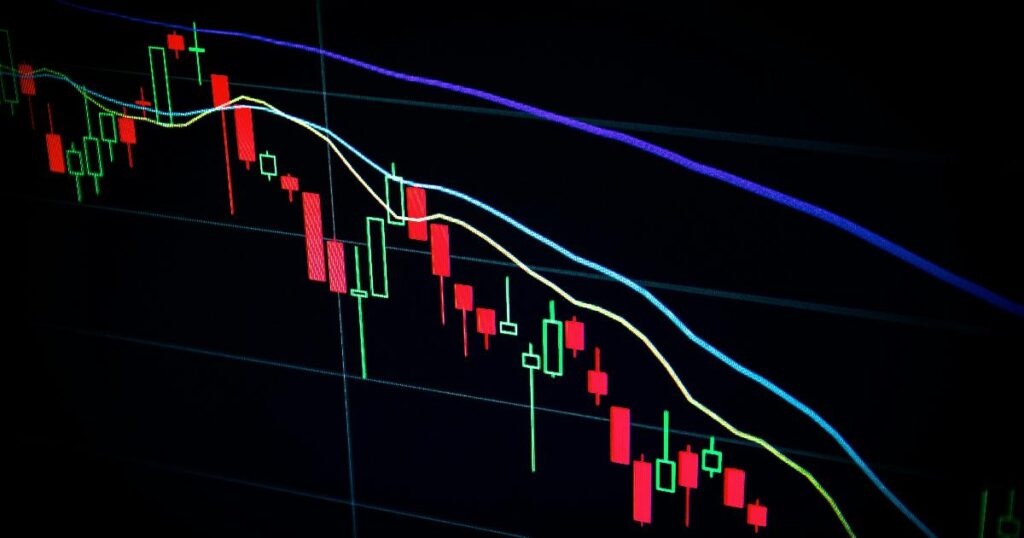

A chart showing US dollar volatility and its impact on a diversified investment portfolio, illustrating the US dollar as a portfolio risk factor
Market Risks

The Dollar Hasn’t Moved Much in a Year — That’s Exactly Why Investors Should Pay Attention

For eleven months, the U.S. dollar has done almost nothing. The Dollar Index has traded inside a band of roughly five percent, and measures of currency volatility have drifted toward four-year lows. To a casual observer, that sounds like the opposite of a risk. Quiet markets feel safe. But currency analysts who track the dollar closely describe this kind of compression differently: as a coiled spring. Volatility tends to be mean-reverting — long stretches of calm are typically followed by a release, not a permanent plateau — and when that release comes, it rarely announces itself politely. The practical question for an ordinary investor isn’t whether they trade currencies. It’s whether they hold U.S. or foreign stocks, bond funds, commodity exposure, or an international ETF — because if so, the dollar is already quietly part of their portfolio, whether they priced it in or not.

A stock market chart on a monitor beside a risk checklist, illustrating market volatility vs portfolio risk in a crisis
Market Risks

The Difference Between a Market That Falls and a Portfolio That Breaks

In late February 2020, most investors had never heard of a “market-wide circuit breaker.” Three weeks later, many had watched one trigger four times in a single month — something that had happened only once before in the history of U.S. markets. The speed of that crash, and the speed of the recovery that followed roughly two months later, is often told as a story about investor psychology: people panicked, then people who held on were rewarded. That version is not wrong, but it skips the more useful part. March 2020 is a cleaner lesson in market structure — in how a shock moves through liquidity, leverage, and rules-based safeguards — than it is a lesson in willpower.

Scroll to Top