
long-term investing

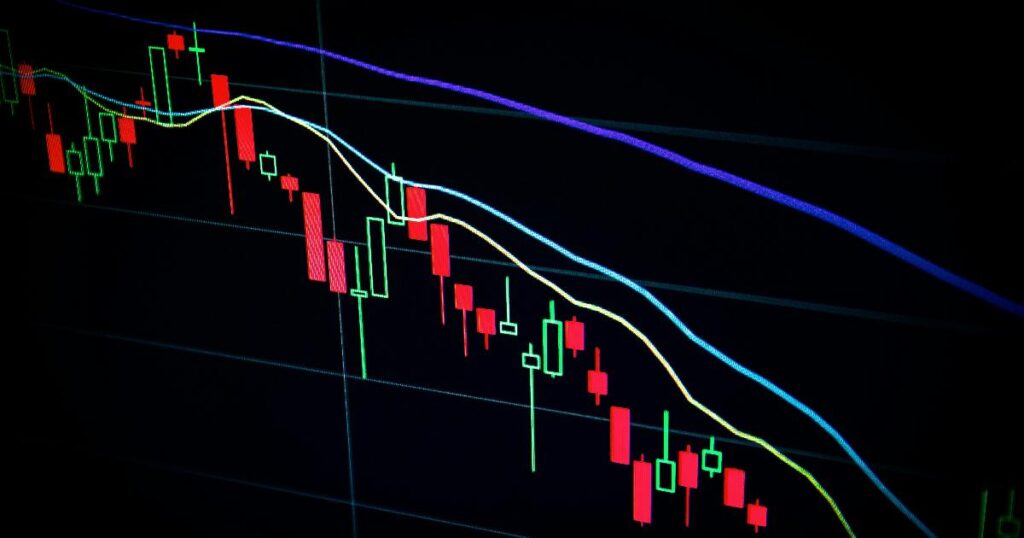
A chart of market volatility showing how the best days and worst days cluster together during market crashes, illustrating the market timing lesson
Market History

Bob Bought at Every Market Peak for 40 Years. He Still Retired a Millionaire.

Two of the most quoted stories in personal finance seem to point in opposite directions. One says a chronically unlucky investor named Bob can buy at the worst possible moments for four decades and still end up rich. The other says missing just ten good trading days out of thousands can gut your lifetime returns. Readers who encounter both eventually ask the obvious question: if timing really matters that much, how did Bob survive it?
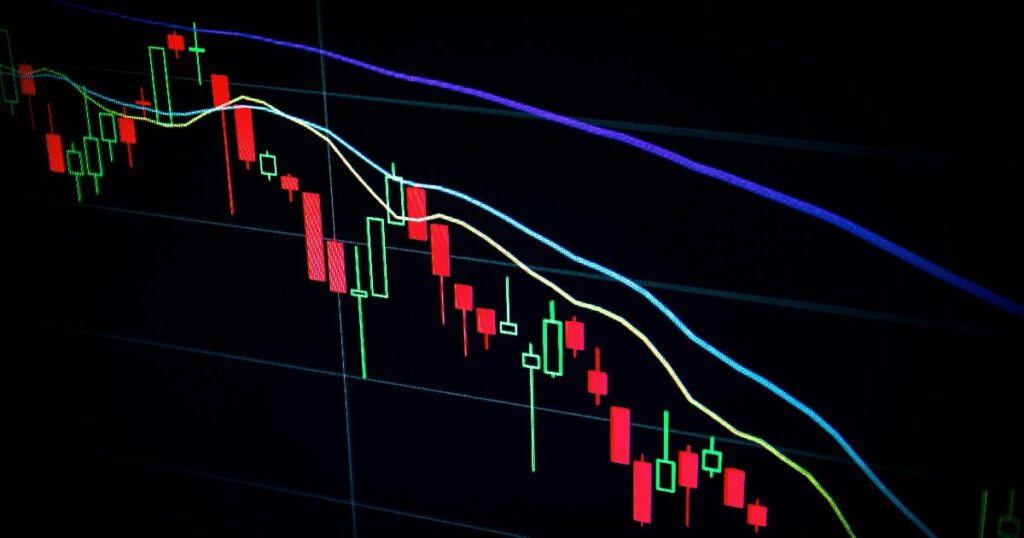
A century of U.S. stock returns shown as a chart, highlighting how the average hides wide volatility and uneven compounding
Market History

A Century of U.S. Stock Returns: Why the Average Hides More Than It Reveals

Imagine buying U.S. stocks at some random moment over the past hundred years and then asking a simple question: what actually happened next? Not on average, not in theory — what happened to your money over the following month, year, decade, or two? The honest answer is unsettling for anyone who likes tidy numbers: it depends enormously on which “next” you’re asking about, and the single average return figure that gets quoted in almost every retirement calculator obscures that fact almost completely.

Scroll to Top